Engineering
How To Turn On Debug Logging For One User In Production
A customer files a ticket. Something is wrong with their invoices. You can't reproduce it — it works on staging, it works for you, it works for the other four thousand accounts.
You know exactly which log lines would tell you what's happening. They're logger.LogDebug calls that have been sitting in that code path for two years. You can't turn them on, because turning them on turns them on for everyone — at production volume that's a five-figure logging bill and a haystack with one needle in it.
TL;DR — The standard advice, "raise the level and filter in your aggregator," puts the filter at the end of the pipeline: you pay to evaluate, format, ship, and ingest every debug record from every request, then throw away 99.99% of it. The fix is to move the level decision to the call site and make it a rule over request context: dana@northwind.example gets DEBUG, everyone else stays at WARN. That's what Quonfig does — and whatever you use, treat targeted logging as a privileged action: scope it, expire it, audit it.
The clearest statement of the problem
In 2017 someone opened Serilog #1078, Add a way to override minimal log level for particular execution context:
In some situations it's desirable to have a way to enable deeper logging for some failing request without affecting the whole system and thus logging huge amount of logs from system under load and without a need to change config or implement functionality to change log level system-wide.
It's been open since 2017, and the same request recurs everywhere: per API request in Elixir (answer: not supported), per call in LiteLLM (whole-proxy debug is "impractical"), from an HTTP header in Serilog, per tenant, per request in Rails. Every one gets told the same thing: raise the level, filter downstream.
Why "raise the level and filter downstream" is the wrong answer
It does work, in the sense that you end up with the logs. The problem is where the filter sits:
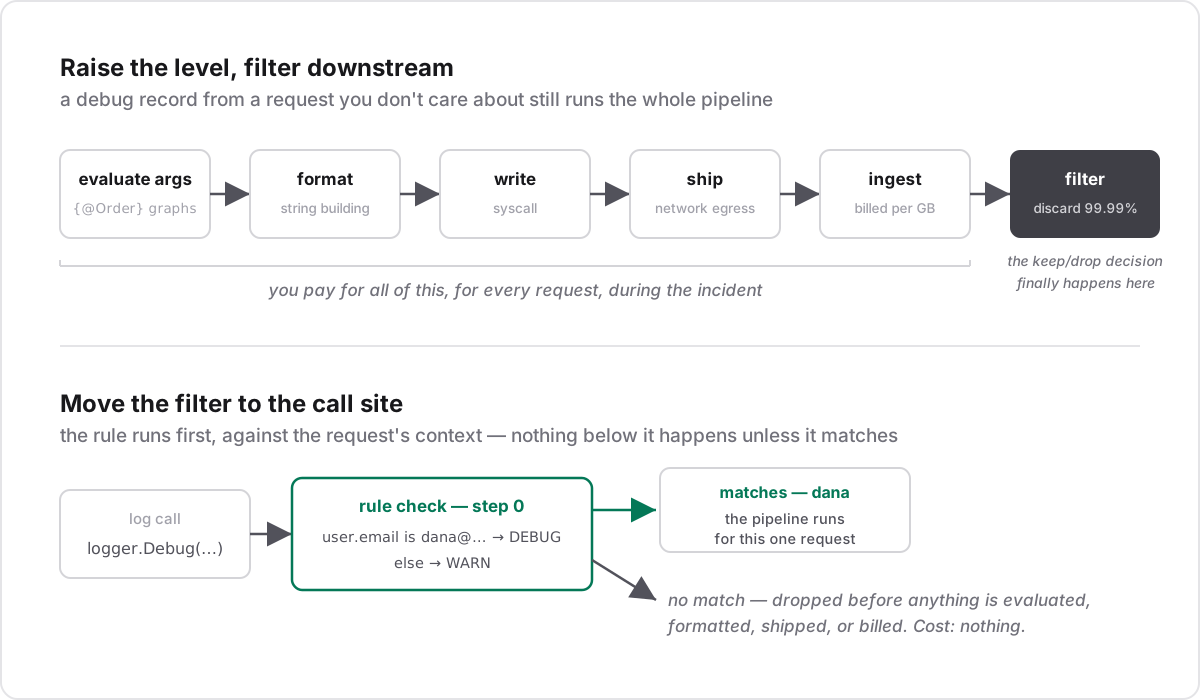
Once the call is enabled, the arguments get evaluated — that innocent logger.LogDebug("state: {@Order}", order) now serializes an object graph. Then the message is formatted, written, shipped over the network, and ingested — which is where you're billed, because you pay on ingest, not on query. Then it's filtered. On a service doing a few thousand requests a second, the first two steps alone can move your p99 — a self-inflicted latency regression that arrives mid-incident.
There's a second-order problem too: verbose logging changes system behavior — slower, more I/O, more GC pressure — so the moment you enable it you're no longer debugging the system that had the bug. Heisenbugs love this.
The filter is in the wrong place. It belongs at step 0, at the call site, before anything is evaluated.
Sampling doesn't rescue you either
"We sample traces, isn't that the same thing?" It isn't, and a GitLab engineer laid out why in Gitaly #4808: at a 0.1% sampling rate, when a specific user reports a problem there is no trace data for them. Random sampling gives you a statistically representative view; debugging a customer complaint needs one specific, non-random actor. (The same tension runs through this OpenTelemetry spec discussion — still a discussion because both sides are right.)
What people build instead
Nobody accepts this, so everyone builds something. Four patterns cover it:
- A header that raises the level for one request. INNOQ wrote it up in 2015: an
x-debug-enabledheader intoThreadContext, aDynamicThresholdFilterpromoting that request to TRACE. There's a whole Magento module for it. Elegant — with a problem we'll come back to. - Tenant targeting via MDC. Duda's Multi-Tenant Debugging with Spring Boot: a Logback
TurboFilterreading the tenant ID out of MDC.TurboFilteris the right hook because it runs before the logging event is constructed — step 0, not step 6. - Ring buffer, flush on error. Will Sargent's Triggering Diagnostic Logging on Exception: keep DEBUG in a bounded in-memory buffer, discard continuously, write it out only when something throws. Excellent for crashes, useless for "this customer's invoices are subtly wrong but nothing throws" — and it composes with everything else here.
- Buy it. Salesforce trace flags are per-user debug logs with an expiry, as a platform primitive. Curity scopes debug to specific OAuth clients; Lightrun triggers on users and flags. Will Sargent's Targeted Diagnostic Logging in Production — LaunchDarkly flags wired into Logback — is still the best general writeup; his motivating bug only happens in Europe, on Firefox.
The security half nobody writes about
Pattern 1 — the request header — has a problem most writeups skip:
A client-controlled log level is a trust boundary.
Honor X-Log-Level: DEBUG from any caller and you've built two vulnerabilities at once. An economic denial-of-service: anyone who sends that header in a loop multiplies your ingest bill, no exploit required. And information disclosure into a lower-trust store — the serious one. Debug logs contain what info logs don't: request bodies, deserialized objects, sometimes tokens. Your log aggregator is usually a broader access surface than your database — more readers, different retention, often a third party. Flipping one user to DEBUG can quietly move their sensitive data into the weaker system. Teams find this out the hard way.
There's a privacy dimension too: under GDPR, "we log everything this named individual does, at different retention, because support asked" is a purpose-limitation question. Defensible when scoped and time-bounded; much less so when someone turned it on eight months ago and forgot.
Three requirements follow:
- Target server-side. You decide whose logs are verbose, from identity you've already authenticated — never the caller. (The Magento module gets this right: the header only works with a minted, time-limited key.)
- Time-bound it. Google's Stackdriver logpoints auto-expired after 24 hours — the right instinct.
- Audit it. Debug-for-a-named-customer is an action against that customer's data. Attributable, timestamped.
The general shape of the answer
Strip away the implementations and every working solution does the same thing: move the level decision to the point where request identity is known, and make it evaluate a rule instead of reading a constant.
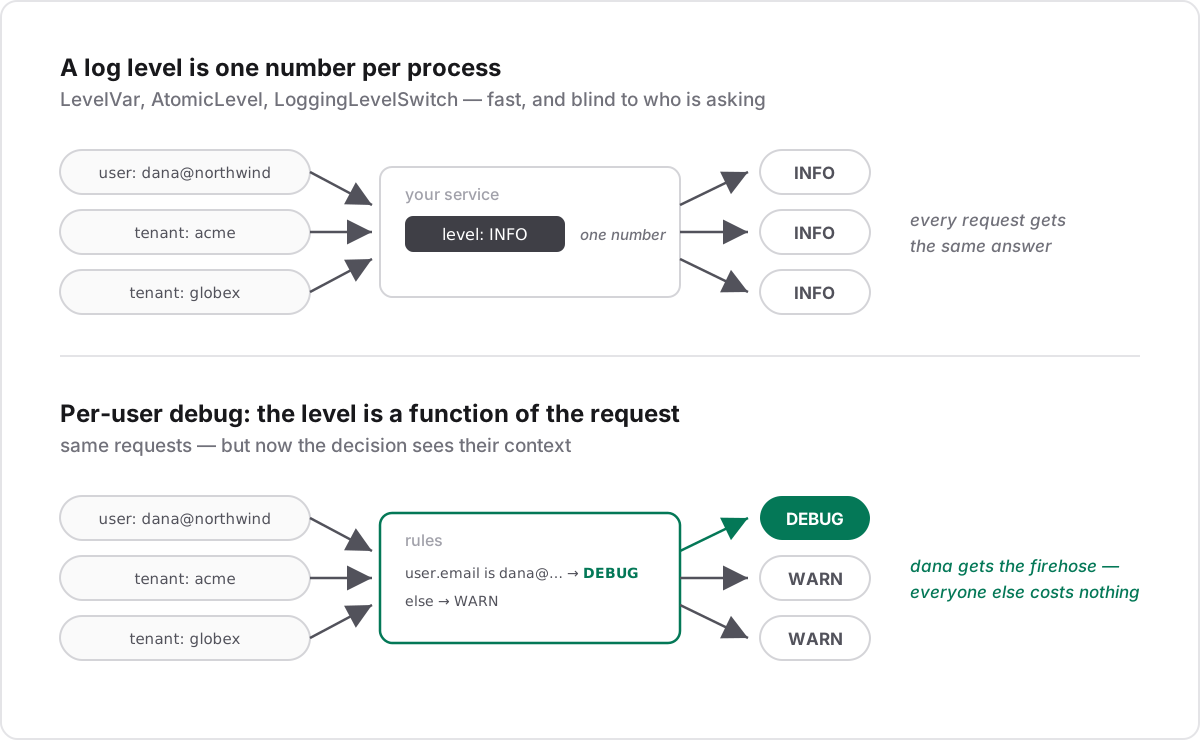
That's why a LoggingLevelSwitch, a slog.LevelVar, or a zap.AtomicLevel can't do it — they're one number for the whole process. That's their entire design; it's why they're fast. Per-user targeting means the level is a function of the request, and a function needs an argument. Concretely you need three pieces:
- Rules that live outside the code — otherwise "debug for this customer" is a deploy.
- Request context at the call site — user, tenant, whatever you target on.
- The check before evaluation — so you never pay for messages you discard.
Doing it with Quonfig
This is what we built Quonfig for: the three pieces above, with the rules stored in git and pushed to every instance over SSE. The rule itself reads like the sentence you wanted when the ticket came in:
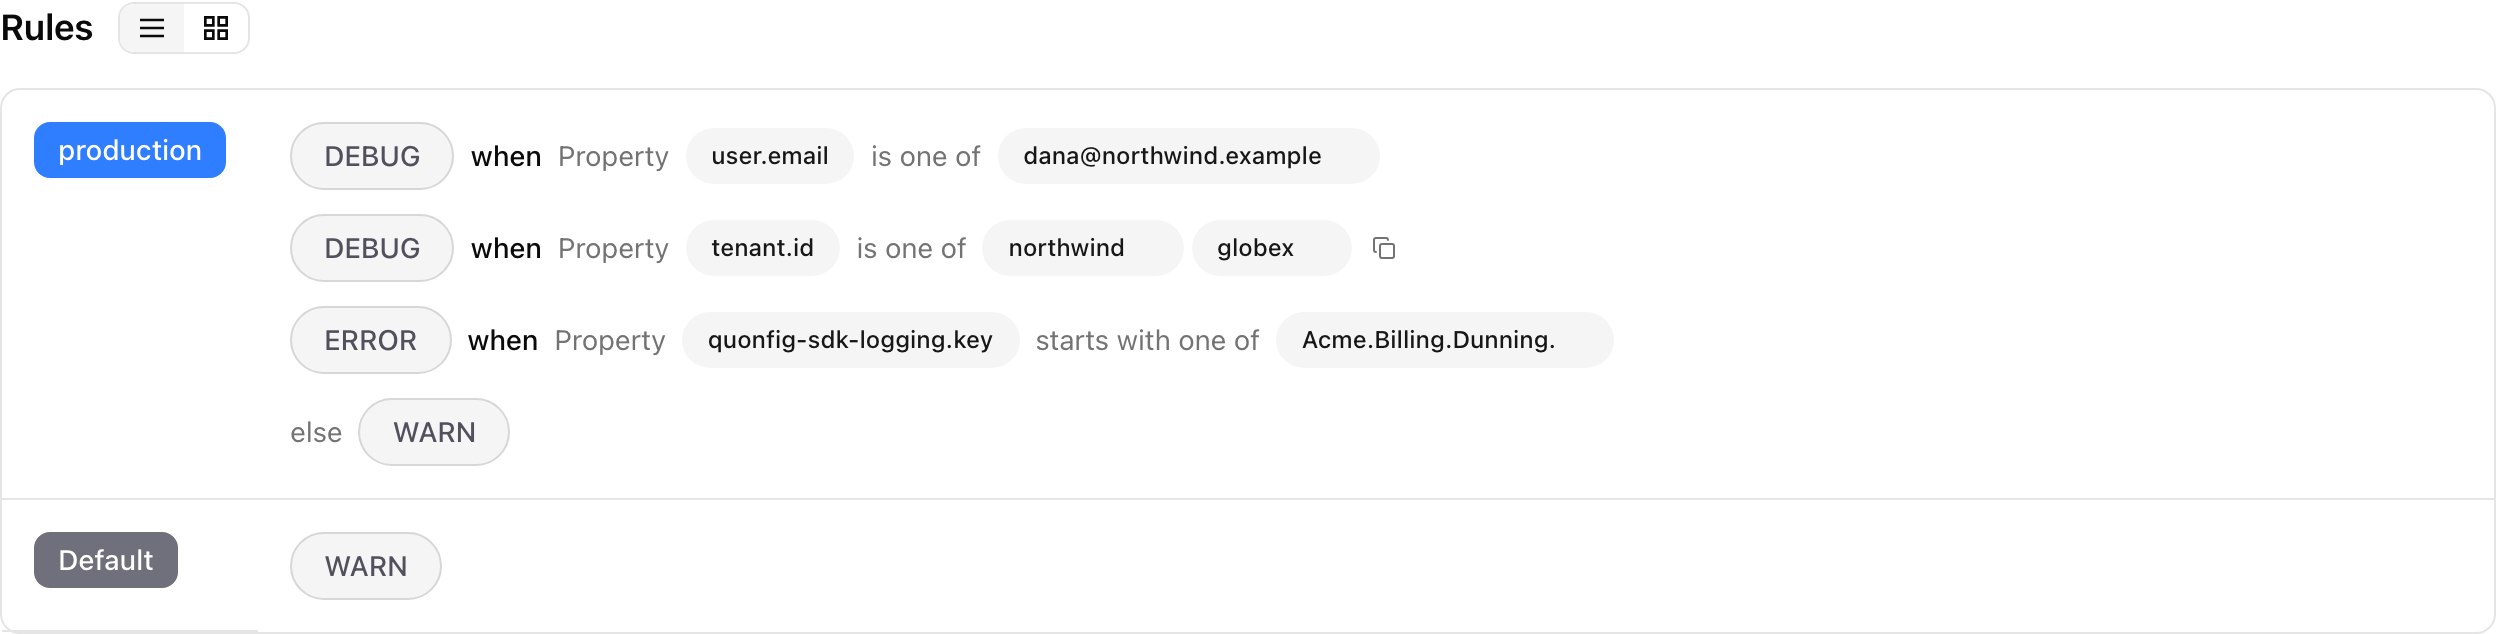
Rules evaluate top to bottom: one named user gets DEBUG, two tenants under investigation get DEBUG, one noisy dunning path is pinned to ERROR, and everyone else stays at WARN. Changes are live on every instance in seconds, audited, and reversed by deleting the rule.
.NET (docs) — attach context per request, then ask at the call site:
app.UseQuonfigContext((http, ctx) =>
{
    if (http.User.FindFirst(ClaimTypes.Email)?.Value is { } email)
        ctx["user"] = new ContextProperties { ["email"] = email };

    if (http.User.FindFirst("tenant_id")?.Value is { } tenant)
        ctx["tenant"] = new ContextProperties { ["id"] = tenant };
});
public sealed class InvoiceService(IBoundQuonfig quonfig, ILogger<InvoiceService> logger)
{
public void Compute(Invoice invoice)
{
if (quonfig.ShouldLog("Acme.Billing", Quonfig.Sdk.LogLevel.Debug))
{
logger.LogDebug("Computing {Id}: {@Lines}", invoice.Id, invoice.Lines);
}
}
}IBoundQuonfig is scoped, so it already carries this request's context. (Why .NET needs the explicit call — ILogger.IsEnabled has no context parameter — is covered in the .NET post.)
Go (docs) — attach a ContextSet to the context.Context and log normally:
cs := quonfig.NewContextSet().
    WithNamedContextValues("user", map[string]interface{}{"email": user.Email}).
    WithNamedContextValues("tenant", map[string]interface{}{"id": tenant.ID})

ctx := quonfig.ContextWithContextSet(r.Context(), cs)

logger.DebugContext(ctx, "computing invoice total", "amount", total)
Go needs no guard at all: slog.Handler.Enabled(ctx, level) receives the context, so NewQuonfigHandler makes ordinary DebugContext calls targetable. Two traps: use DebugContext, not Debug — the non-context methods have nowhere to carry the targeting data, so rules silently never match — and it must be the handler, not the leveler, since slog.Leveler.Level() takes no arguments.
The same integration exists in every server SDK — each page has a Dynamic Log Levels section: Node · Python · Java · Ruby · Go · .NET · JavaScript · Swift
One thing to internalize: the logger path is not part of the config key. There's one config per service, and the path arrives as a context property (quonfig-sdk-logging.key) — no automatic parent walk, so Acme::Billing at DEBUG doesn't implicitly cover Acme::Billing::Invoicing; you write a "starts with" rule, ordered above the general one. That's a different model from log4j's implicit hierarchy, and it's also what makes per-user targeting possible: once the logger path is just another targeting dimension, it sits alongside user.email and tenant.id in the same rule engine — which is exactly what the third rule in the screenshot above is doing.
Honest limits
Things I'd want to know before adopting any of this, including ours:
- Call-site impact depends on the language. Where the logging API threads context (Go's
slog), targeting works through a filter installed once at startup — no call-site changes. Where it doesn't (ILogger.IsEnabled, Ruby's stdlib), per-user rules need an explicitShouldLogon the handful of paths you care about. Either way, guarding expensive log arguments is ordinary hygiene that no filter can do for you — a filter runs inside the call, after the arguments exist. - You're adding a dependency to your logging path. Ask what happens when it's unreachable. Quonfig evaluates against a locally cached config and fails open — no rule means log it — so a network partition can't silence your logs. Verify the equivalent for whatever you pick, including a hand-rolled one.
- It only turns on logging that exists. If the interesting path has no debug statements, you still need a deploy — that's the gap Datadog Dynamic Instrumentation and Lightrun address, and a different product category.
- Targeted logging is a privileged action against a named person's data. Scope it, expire it, audit it — see above.
Where to start
If you take one thing away: the reason this is hard isn't that log levels are badly designed. It's that a log level is one number and you're asking a question about one request.
Once you see it that way the options get clearer. Ring buffers if your failures throw. A TurboFilter or equivalent if you're on the JVM and want to build it yourself. Config-driven rules if you want it to work across services without a deploy each time.
What I'd avoid is the default advice. "Raise the level and filter downstream" is what every one of those threads gets told, and it's the one answer that puts the filter in the most expensive place possible — after you've already paid for everything.
Also: Change log levels at runtime in Go · Change log levels at runtime in .NET, down to a single tenant
Want to try it?
Quonfig stores your config in git. Feature flags, dynamic config, log levels, and secrets — all as files you own.